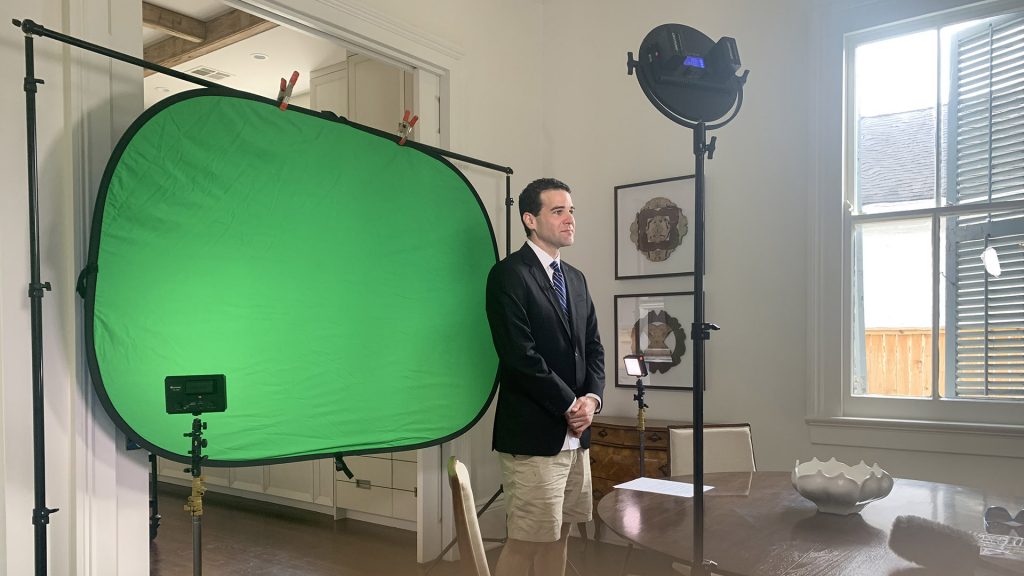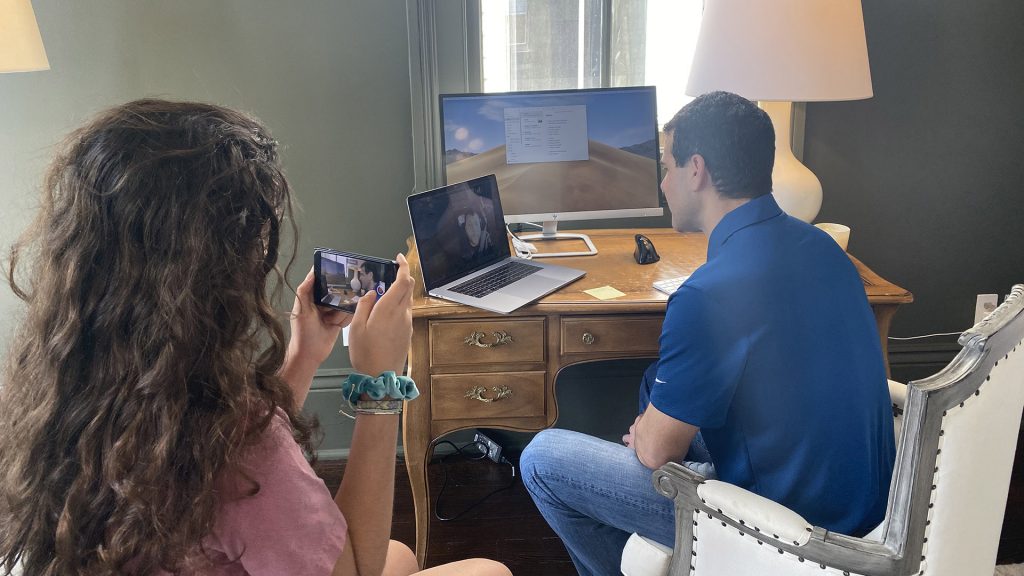
It’s an idea that hits close to home, so perhaps it’s fitting that it actually started at home.
Lee Zurik and seven colleagues from Gray Television’s national InvestigateTV unit and its New Orleans station WVUE put themselves into self-quarantine on March 10. That’s the day they found out that a delegate at an Investigative Reporters and Editors (IRE) conference that they all attended in their home city had tested positive for COVID-19.

Zurik, who also anchors the 5, 9 and 10 p.m. newscasts on WVUE, started doing reporting and TV hits from home, but he and the enterprise team also started brainstorming. “We were all in self-isolation, and we were just talking about what we can bring to our viewers that they can’t get elsewhere,” Zurik says. “The biggest issue is going to be where the [new] cases are popping up. We felt that that was going to be the real telltale sign.”
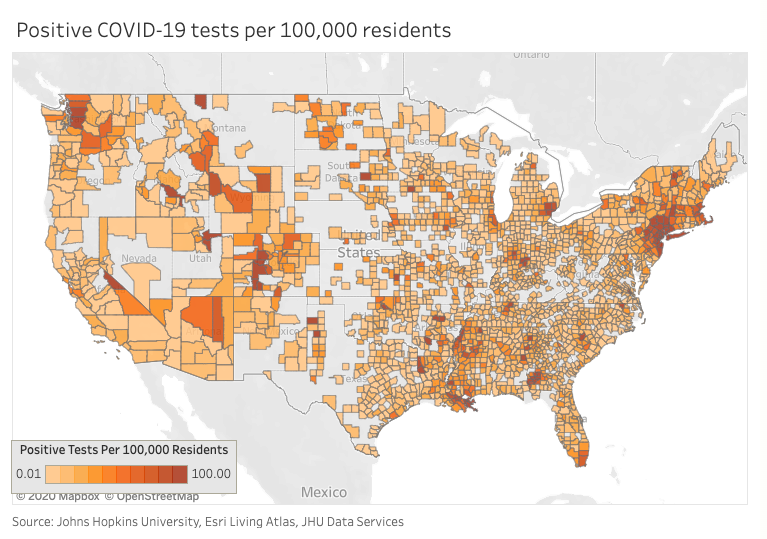
So the team got to work and built an impressive tool — an interactive COVID-19 Tracker that collects positive test results in every single county in the United States, updates the data every day, and makes the information easily accessible. Just mouse over or search the map, find your county, and you can see how many cases per capita have cropped up there.

It’s one of the only county-level tracking tools around — and the only one I know of built by a local station group. (The New York Times recently announced its own county-by-county data project, calling it a “round-the-clock effort” and saying “with no detailed government database on where the thousands of coronavirus cases have been reported, a team of New York Times journalists is attempting to track every case.”)
InvestigateTV has been doing that since March 16. Cody Lillich, Jamie Grey and Jill Riepenhoff built the first prototype, enlisting Indiana University students from the Arnolt Center for Investigative Journalism to help in the painstaking task of gathering the data, in some cases only available from the counties themselves.
For the first week, the map had to be populated manually. “It was a bear,” says Zurik. But then the team had the bright idea of asking (and paying) IRE to write a program that would automate the process, so now the tracker scrapes county data from Johns Hopkins University for fresh numbers. “It was like the bear had been lifted off our shoulders,” Zurik says.
The interactive map is available to all 93 Gray stations, as are the team’s other tools and nightly TV reports. Zurik says the data helped him flag New Orleans as a rising hot spot well before the city drew national attention. He has sent emails to news directors, including colleagues in Albany GA and Shreveport LA, flagging spikes in the per-capita case rate in their counties. “It’s not just the now, but it’s also tracking it over time,” Zurik says, “so we can say, ‘Look, this area has risen 100% in a day or two, and we need to pay attention to that area right now.’”
InvestigateTV also has tools to track multiple other indicators, such as unemployment claims, state-by-state restrictions, and even pharmacy stocks of Hydroxychloroquine. Zurik says data on death rates and state-by-state testing is on the way.
The county-by-county coronavirus tracker is obviously a great example of an ownership group creating a compelling innovation at the national level for the benefit of all its stations, but I also give Zurik and his team props for reaching out to IRE to help improve and scale the new product. It’s collaboration not just across but beyond the station group: that’s an idea worth tracking in your company too.
Zurik is back at the station and back to full-time anchoring while leading the national investigative unit. Most of his team is still working from home, but everyone is fine. “I think stations across the country are doing incredible work,” Zurik says. “I hope we are contributing to that.”